
Introduction
Anchor chart are powerful visual tools designed to enhance teaching and learning in the classroom. Unlike traditional notes or handouts, anchor charts are dynamic and interactive, serving as both teaching aids and lasting references for students. They act as visual anchors—hence the name—helping learners connect abstract ideas to concrete representations. By translating complex concepts, strategies, or processes into clear visual forms, anchor charts make learning more accessible and engaging for students of all ages.
These charts can take many forms, from colorful posters and diagrams to step-by-step guides, and are often created collaboratively with students to reflect their understanding. This collaborative approach not only fosters a sense of ownership in the learning process but also encourages active participation. Students can refer to anchor charts throughout a lesson or even over weeks, reinforcing key concepts and supporting independent thinking.
Moreover, anchor charts serve multiple purposes in the classroom. They act as reminders of previously taught material, guides for applying strategies, and references for problem-solving or completing tasks. By offering a consistent, visible point of reference, they reduce students’ reliance on memorization and enhance comprehension, particularly for visual learners or those who benefit from repetitive reinforcement.
In essence, anchor charts bridge the gap between instruction and retention. They transform abstract ideas into tangible visuals, making learning not just more understandable but also more engaging. By providing clarity, structure, and ongoing support, anchor charts empower students to take ownership of their learning and succeed academically.
What is an Anchor Chart?
An anchor chart is a purposeful visual tool used in classrooms to capture, display, and reinforce essential concepts, strategies, processes, or guidelines. It serves as a visual reference point that supports both teaching and learning, helping students internalize and retain knowledge more effectively. The term “anchor” is intentional: these charts act as anchors for students’ thinking, grounding abstract or complex ideas in a tangible, accessible format.
Anchor charts can take the form of posters, charts, or interactive visual displays. They may be created solely by the teacher to guide instruction or, more effectively, developed collaboratively with students. Collaborative creation allows students to contribute ideas, examples, or illustrations, fostering a sense of ownership and active engagement with the material. This participatory approach ensures that the chart reflects student understanding, making it more meaningful and memorable.
Key characteristics of anchor charts include:
- Collaborative Creation: Often made with student input to encourage engagement and reinforce understanding.
- Classroom Display: Positioned where students can easily see and reference it, acting as a continuous learning tool.
- Visual and Colorful: Incorporates diagrams, symbols, illustrations, or color coding to make information visually appealing and easier to process.
- Focused Content: Highlights key concepts, strategies, or step-by-step processes without overwhelming students with excessive information.
By combining visual appeal with concise, student-friendly content, anchor charts serve as an effective bridge between instruction and retention. They provide students with a reliable reference point, reinforcing learning, encouraging independent problem-solving, and making abstract ideas more concrete and understandable.
Purpose of Anchor Charts
Anchor charts serve multiple vital purposes in the classroom, going far beyond simple decoration. They are designed to support both teaching and learning by providing students with clear, consistent, and visually engaging references. Their purpose extends to enhancing understanding, fostering independence, promoting engagement, and even supporting classroom management.
- Support Learning:
Anchor charts help students retain and recall essential concepts, strategies, and processes. By presenting information visually and concisely, they transform abstract ideas into tangible, easy-to-understand references. Students can refer to them during lessons, homework, or group activities, reinforcing what they have learned and making learning more effective. - Encourage Independence:
Rather than relying solely on teacher guidance, students can use anchor charts to find answers or review steps independently. This encourages self-reliance, builds confidence, and promotes problem-solving skills, allowing students to take ownership of their learning process. - Promote Engagement:
When anchor charts are created collaboratively with students, they actively involve learners in the educational process. Students contribute ideas, examples, or illustrations, which increases their investment in the material and deepens comprehension. This participatory approach also strengthens classroom community and encourages discussion and collaboration. - Visual Reinforcement:
Many learners benefit from seeing information presented visually. Anchor charts use colors, symbols, diagrams, and clear layouts to reinforce key concepts. For visual learners, this method enhances understanding and retention, making abstract or complex material easier to grasp. - Classroom Management:
Beyond academics, anchor charts can organize classroom routines, expectations, or rules. By clearly displaying procedures or behavioral guidelines, they help manage classroom flow and ensure students understand expectations. This visual reinforcement reduces confusion and supports a positive, structured learning environment.
In essence, the purpose of anchor charts is to make learning visible, accessible, and interactive. They not only reinforce instruction but also cultivate independent, engaged, and organized learners who can actively navigate and apply knowledge.
Types of Anchor Charts
Anchor charts come in various forms, each designed to serve a specific educational purpose. By understanding the different types, teachers can select or create charts that best meet the needs of their students and classroom goals. Here are the main types of anchor charts commonly used in education:
- Strategy Anchor Charts:
These charts focus on teaching students’ strategies for completing tasks in reading, writing, or problem-solving. For example, a strategy chart for reading might outline steps to make predictions, summarize a passage, or infer meaning from context. In writing, a strategy chart could guide students through brainstorming, drafting, or revising. By providing clear, step-by-step approaches, strategy anchor charts equip students with tools they can repeatedly apply across subjects. - Concept Anchor Charts:
Concept charts are designed to clarify key academic concepts. They often explain ideas in subjects like math, science, or language arts. For instance, a concept chart in math might illustrate the steps for long division, while a science chart could depict the water cycle or life cycle of a butterfly. These charts transform abstract ideas into concrete visuals, making it easier for students to understand and remember essential concepts. - Procedural Anchor Charts:
Procedural charts focus on step-by-step processes. They guide students through sequences required to complete tasks accurately. Examples include charts showing “How to Solve a Word Problem,” “Steps to Write a Paragraph,” or “Procedure for Conducting a Science Experiment.” Procedural anchor charts support consistency, ensuring that students follow proper methods and develop structured thinking skills. - Behavior and Expectations Charts:
These charts outline classroom rules, routines, or behavioral expectations. By visually displaying acceptable behavior and procedures, they promote a positive learning environment and help manage student conduct. Examples include charts showing steps for lining up, raising hands, or transitioning between activities. Such charts create clarity and consistency, reducing confusion and reinforcing accountability. - Interactive Anchor Charts:
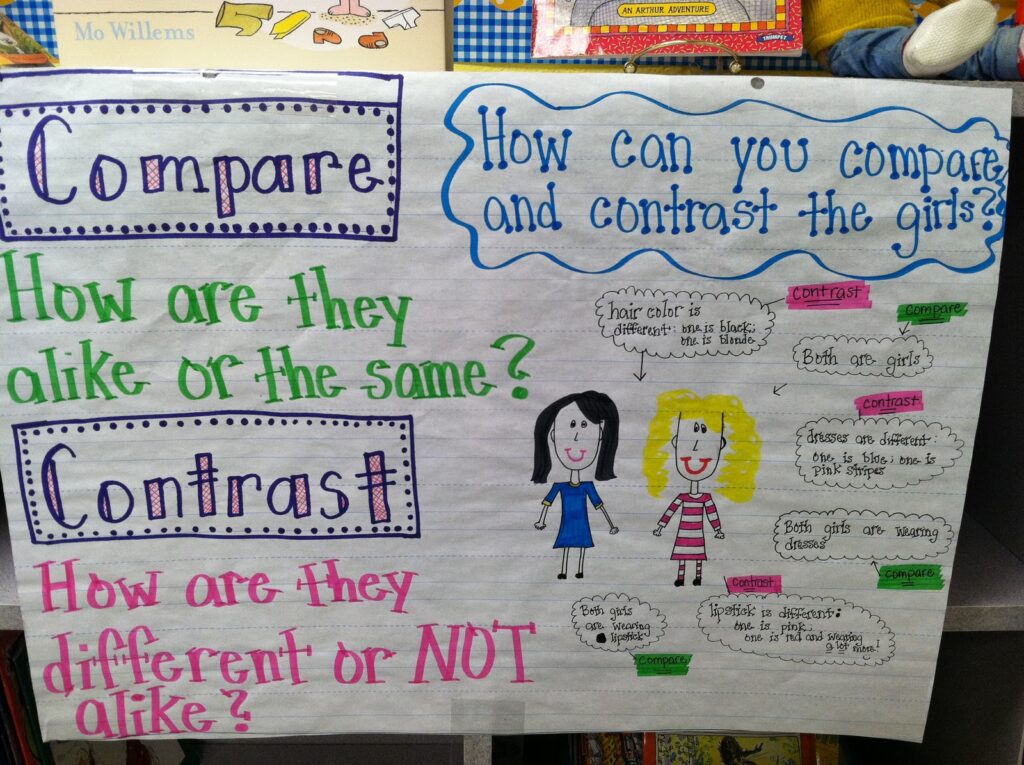
Interactive charts invite student participation. Students may add ideas, examples, illustrations, or reflections directly onto the chart, making learning collaborative and dynamic. This type of anchor chart not only reinforces content but also encourages ownership and deeper engagement. Interactive charts are particularly effective for group activities, discussions, or projects, as they reflect collective understanding.
By utilizing these diverse types of anchor charts, educators can address multiple learning styles, reinforce key skills, and create a classroom environment where knowledge is both visible and actively applied.
How to Create an Effective Anchor Chart
Creating an effective anchor chart requires careful planning, clarity, and engagement. The goal is to produce a visual tool that not only captures essential information but also supports students’ understanding and retention. Here are the key steps and best practices for designing anchor charts that truly enhance learning:
- Focus on One Concept:
Simplicity is key. An anchor chart should concentrate on a single concept, skill, or strategy at a time. Overloading a chart with too much information can overwhelm students and reduce its effectiveness. Clear, focused content allows students to easily grasp and reference the material when needed. - Use Student-Friendly Language:
Anchor charts should be written in clear, simple language that students can understand. Avoid complex jargon or overly technical terms, and instead use words and phrases that reflect students’ comprehension levels. The aim is to present the information in a way that is easy to understand and apply. - Make it Visual:
Visual elements significantly enhance learning and retention. Use colors, symbols, diagrams, charts, and illustrations to represent key ideas. Highlight important points with bold lettering or color coding. Visual cues help students process information quickly and cater to visual learners. - Involve Students:
Collaborative creation increases engagement and ownership. Invite students to contribute examples, drawings, or ideas as the chart is being made. This participation ensures the chart reflects their understanding and encourages active learning. Interactive elements can also make the chart more memorable. - Display Prominently:
Placement matters. Anchor charts should be displayed where students can easily see and refer to them throughout lessons or independent work. Whether on a classroom wall, whiteboard, or bulletin board, visible charts act as constant references and reminders for students. - Update Regularly:
Learning evolves, and so should anchor charts. Update them to reflect new concepts, strategies, or refinements in understanding. Regularly refreshing charts keeps them relevant, reinforces ongoing learning, and signals to students that knowledge is dynamic and growing.
By following these principles, teachers can create anchor charts that are not only visually appealing but also highly functional as instructional tools. Effective anchor charts make learning concrete, provide continuous support, and foster a classroom environment where students feel empowered to access and apply knowledge independently.
Benefits of Using Anchor Charts
Anchor charts are more than just visual aids—they are strategic tools that enhance both teaching and learning. Their benefits extend across academic, cognitive, and behavioral domains, making them invaluable in classrooms of all grade levels.
- Reinforces Memory and Learning:
Anchor charts help students retain and recall information by providing a visual representation of key concepts, strategies, or processes. The combination of text, visuals, and structure makes learning more concrete, allowing students to internalize material more effectively. Over time, repeated reference to these charts strengthens memory and deepens understanding. - Improves Student Engagement and Participation:
When students are involved in the creation of anchor charts or encouraged to interact with them, engagement rises significantly. Collaborative chart-making fosters a sense of ownership and active participation, turning students from passive listeners into active learners. This involvement encourages curiosity, discussion, and meaningful classroom interaction. - Supports Diverse Learning Styles:
Anchor charts cater to various learning preferences, including visual, auditory, and kinesthetic learners. Visual learners benefit from diagrams, colors, and symbols; auditory learners can pair the chart with explanations or discussion; and kinesthetic learners engage when they contribute to or manipulate chart elements. This inclusivity ensures that all students have access to learning in ways that resonate with them. - Encourages Independent Thinking and Problem-Solving:
By acting as a readily available reference, anchor charts empower students to solve problems and complete tasks independently. Instead of repeatedly asking the teacher for guidance, students can consult the chart, apply strategies, and verify their understanding. This builds confidence, self-reliance, and critical thinking skills. - Serves as a Quick Reference During Lessons:
Anchor charts provide a constant, visible point of reference during instruction. Teachers can use them to reinforce key points, and students can quickly check procedures, rules, or strategies without disrupting the flow of learning. This accessibility makes lessons smoother and more effective, ensuring that students have support when they need it.
In summary, anchor charts are versatile, powerful tools that enhance learning, foster engagement, and build independent, confident learners. By making knowledge visible, interactive, and accessible, they transform classrooms into spaces where students are actively supported in achieving academic success.
Examples in the Classroom
Anchor charts are highly versatile and can be applied across subjects and grade levels to reinforce learning and support student understanding. By providing clear visual guidance, they help students navigate academic tasks and classroom expectations effectively. Here are some practical examples of how anchor charts can be used in different areas:
- Reading – “Steps to Make Predictions”:
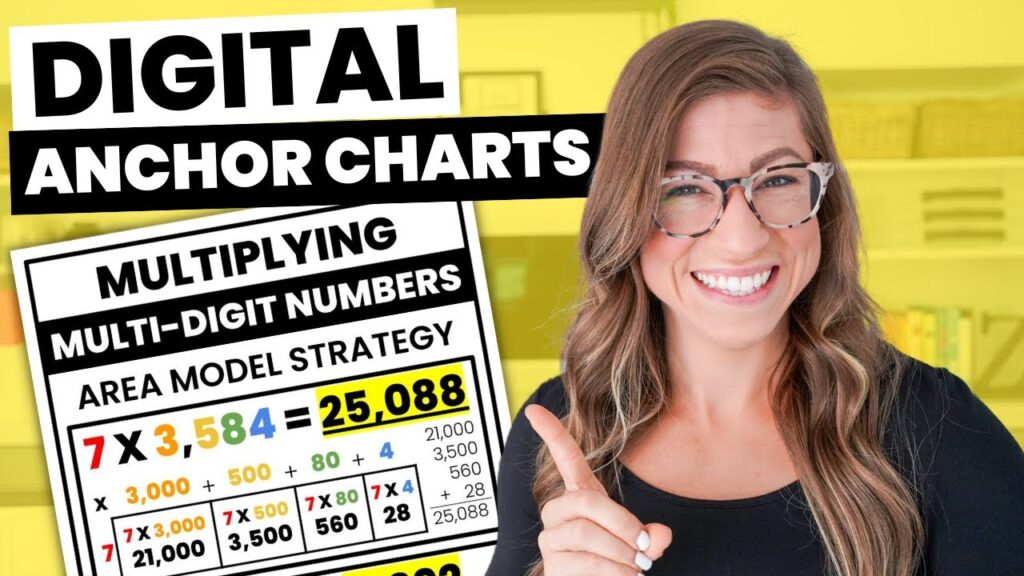
In reading lessons, anchor charts can guide students through the process of predicting what might happen in a story. A chart might outline steps such as examining the title, analyzing illustrations, and using prior knowledge to make informed guesses. This visual reference helps students develop critical thinking and comprehension skills while reading independently or in groups. - Math – “Multiplication Strategies”:
Anchor charts in math can break down complex operations into manageable steps. For example, a multiplication strategies chart may illustrate methods like repeated addition, arrays, or the distributive property. By referring to the chart, students can choose and apply strategies confidently, reducing mistakes and increasing accuracy. - Writing – “Elements of a Strong Paragraph”:
In writing instruction, anchor charts can highlight key components of a well-structured paragraph, such as topic sentences, supporting details, and concluding statements. Providing examples and visual cues on the chart helps students organize their thoughts and produce cohesive, high-quality writing. - Science – “Water Cycle Steps”:
Science anchor charts can depict processes, cycles, or concepts visually. A water cycle chart, for instance, may illustrate stages like evaporation, condensation, precipitation, and collection, using arrows and labeled diagrams. This makes abstract scientific ideas tangible and easier to grasp for learners of all levels. - Behavior – “Classroom Rules Everyone Follows”:
Beyond academics, anchor charts can reinforce classroom expectations and positive behavior. A behavior chart might list rules for lining up, raising hands, or participating respectfully. Displaying these rules visually helps students internalize expectations, promotes consistency, and supports classroom management.
By incorporating anchor charts across subjects, teachers create a consistent, supportive, and interactive learning environment. Students benefit from having clear, visual guidance that they can refer to during lessons, practice independently, and apply across tasks and activities.
Conclusion
Anchor charts are far more than decorative elements in a classroom—they are essential instructional tools that play a significant role in supporting teaching and learning. By providing a clear, visual representation of key concepts, strategies, or procedures, anchor charts make abstract ideas tangible, helping students understand and retain information more effectively.
One of the greatest strengths of anchor charts is their ability to promote interactive learning. When students are involved in their creation, they actively engage with the material, reinforce their understanding, and develop a sense of ownership over their learning. This collaborative approach not only strengthens comprehension but also encourages critical thinking, problem-solving, and independent learning.
Anchor charts also serve as consistent reference points throughout lessons and across the school year. Students can consult them to review processes, apply strategies, or recall important concepts, fostering confidence and autonomy in the classroom. Additionally, by supporting diverse learning styles—visual, auditory, and kinesthetic—anchor charts ensure that every student has access to tools that enhance their learning experience.
In essence, the practice sheets transform the classroom into a dynamic, student-centered environment. They bridge the gap between instruction and understanding, provide continuous support for learners, and empower students to actively participate in their educational journey. Properly designed and effectively implemented, the practice sheets are invaluable assets that enrich both teaching and learning outcomes.
FAQs
Q1: What exactly is an the practice sheet?
An anchor chart is a visual teaching tool that displays important concepts, strategies, processes, or guidelines. It serves as a reference point for students to help them understand and retain knowledge more effectively. the practice sheet can be created by the teacher, collaboratively with students, or both.
Q2: Can the practice sheet be used for all grade levels?
Yes. Anchor charts are versatile and can be adapted for students of any age. While younger students benefit from bright visuals and simple text, older students can use charts with more complex information, step-by-step guides, or subject-specific strategies.
Q3: How do anchor charts support independent learning?
Anchor charts act as a readily available reference for students, allowing them to check steps, strategies, or rules without needing constant guidance from the teacher. This encourages problem-solving, critical thinking, and self-reliance.
Q4: Can the practice sheet be digital?
Absolutely. Digital the practice sheet can be created using tools like Google Slides, Canva, or interactive whiteboard software. They are particularly useful for online or hybrid classrooms and can be updated and shared easily.
Q5: How often should the practice sheets be updated?
The practice sheets should be updated regularly to reflect new concepts, strategies, or refinements in learning. Keeping them current ensures they remain relevant and continue to support students’ understanding effectively.
Q6: Are the practice sheets only useful for academic subjects?
No. The practice sheets are effective for behavior management, classroom routines, and social-emotional learning as well. They can visually display rules, expectations, or strategies for conflict resolution, making them versatile tools for both academic and non-academic purposes.
Q7: How can teachers make the practice sheet more engaging for students?
Teachers can involve students in the creation process, allow them to add drawings or examples, use colors and visuals, and make charts interactive. This collaborative approach increases engagement, ownership, and comprehension.